GRAFIK 3D DENGAN MENGGUNAKAN MATLAB
>> vx=[-4:0.2:4];
>> vy=[-3:0.2:3];
>> [x,y]=meshgrid(vx,vy);
>> z=x.*y.*(x.^2-y.^2)./(x.^2+y.^2+eps);
>> figure
>> plot3(x,y,z)
>> grid on
>> figure
>> mesh(x,y,z)
>> view(-37,15)

Gambar 1a
>>
mesh(x,y,z)
>>
view(-28,19)
>>
surfc(x,y,z)

Gambar 1b
>>
colormap hot

Gambar 1c
>> shading
interp
>>
colormap hsv

Gambar 1d
>> x=[-4:0.5:4];
>> [x,y]=meshgrid(x,x);
>> z=1./(3+x.^2+y.^2);
>> surfl(z)
>> shading interp
>> colormap hot
>> xlabel('x');
>> ylabel('y');
Gambar 1
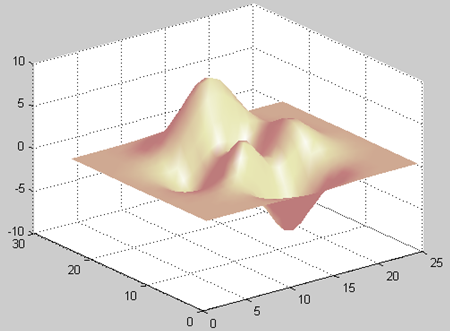
>> z=peaks(25);
>> figure
>> mesh(z)

gambar 2a
>> z=peaks(25);
>> figure
>> mesh(z)
>> surf(z)
>> colormap(jet)%change color map

gambar 2b
>> z=peaks(25);
>> figure
>> mesh(z)
>> surf(z)
>> colormap(jet)%change color map
>> surfl(z)
>> colormap(pink)%change color map
>> shading interp %interpolate colors ac
gambar 2c
Untuk lebih memahami lebih lanjut mengenai materi matematika komputasi, bisa mengunjungi


Tidak ada komentar:
Posting Komentar